Launching a SaaS product is only the beginning; the real test is keeping it reliable as users scale. A well‑crafted post‑launch monitoring checklist gives founders, product leaders, and ops managers the visibility they need to catch issues before they become outages, protect revenue, and sustain growth.
Why a Dedicated Post‑Launch Monitoring Checklist Is Non‑Negotiable
In early‑growth SaaS, every minute of downtime translates directly into churn risk and lost ARR. A dedicated checklist forces teams to move beyond ad‑hoc “let’s see what breaks” attitudes and embed observability into the product DNA. It aligns engineering, product, and support around shared health signals, ensuring that the same criteria are applied across releases, regions, and customer segments. Without this discipline, you’ll face “unknown unknowns” that surface only after a major incident, eroding trust and forcing costly fire‑fighting. Moreover, a checklist becomes a living artifact that new hires can reference, reducing onboarding friction and preserving institutional knowledge as the team scales.
Core Metrics Every Live SaaS Should Track from Day One
Metrics are the pulse of your service. Start with three pillars: availability, performance, and user experience. Track uptime (e.g., 99.9 % SLA), error rates (HTTP 5xx, unhandled exceptions), and latency percentiles (p95, p99) for critical APIs. Complement these with business‑level signals like conversion funnel drop‑off and subscription churn spikes. For multi‑tenant platforms, monitor per‑tenant resource consumption to spot noisy neighbors early. A concise API Integration Reliability Checklist can help you verify that downstream dependencies are also covered. Keep the list short—no more than a dozen core metrics—so dashboards stay readable and alerts remain actionable.
Setting Up Real‑Time Alerting: Tools, Thresholds, and Escalation Paths
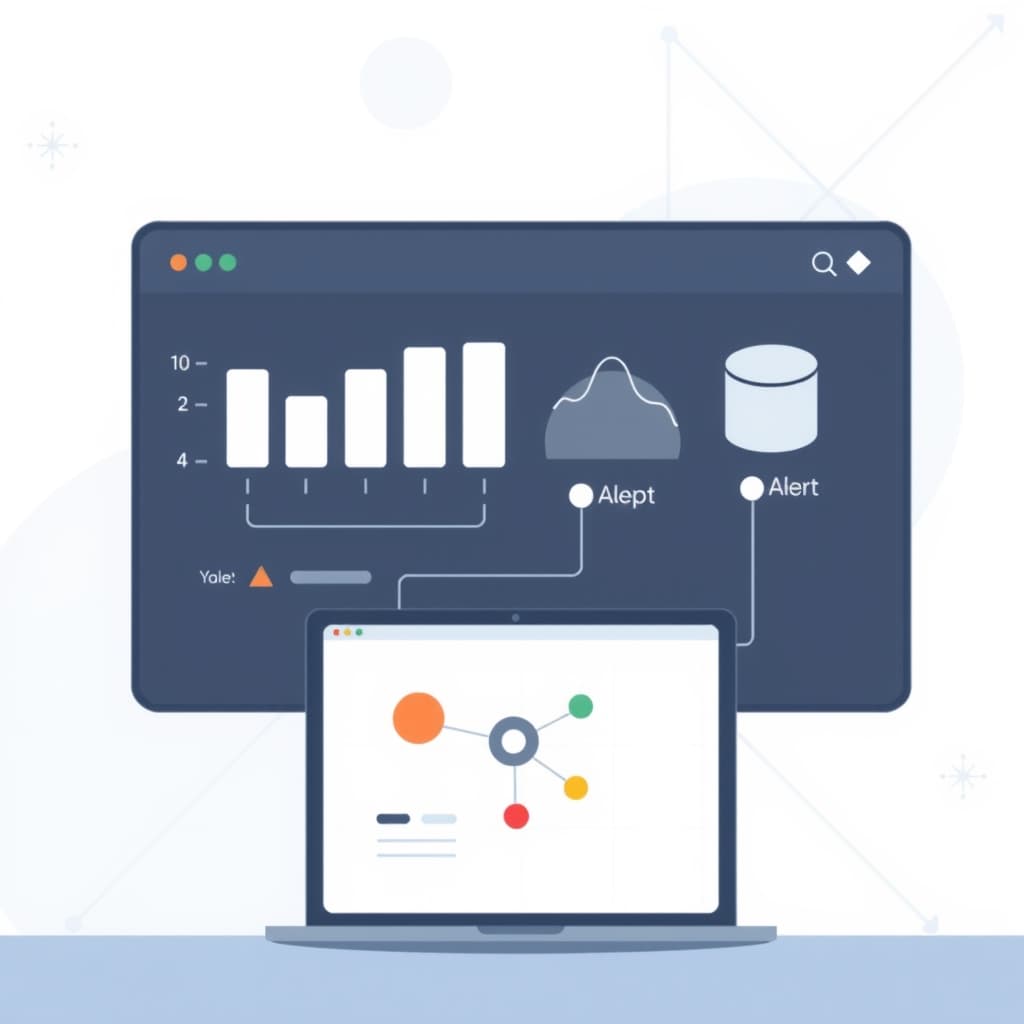
Real‑time alerting turns raw data into rapid response. Choose a unified observability platform (e.g., Datadog, New Relic, or open‑source Prometheus + Alertmanager) that can ingest logs, traces, and metrics. Define thresholds that reflect user impact: for latency, trigger at p99 > 500 ms; for error rate, alert when it exceeds 1 % of total requests over a five‑minute window. Avoid “alert fatigue” by grouping related alerts and using severity levels. Map each alert to an escalation path—on‑call engineer, then team lead, then a manager—ensuring that nobody is left waiting. Document the process in a shared runbook and test it regularly with simulated incidents.
Implementing Health Dashboards for Non‑Technical Stakeholders
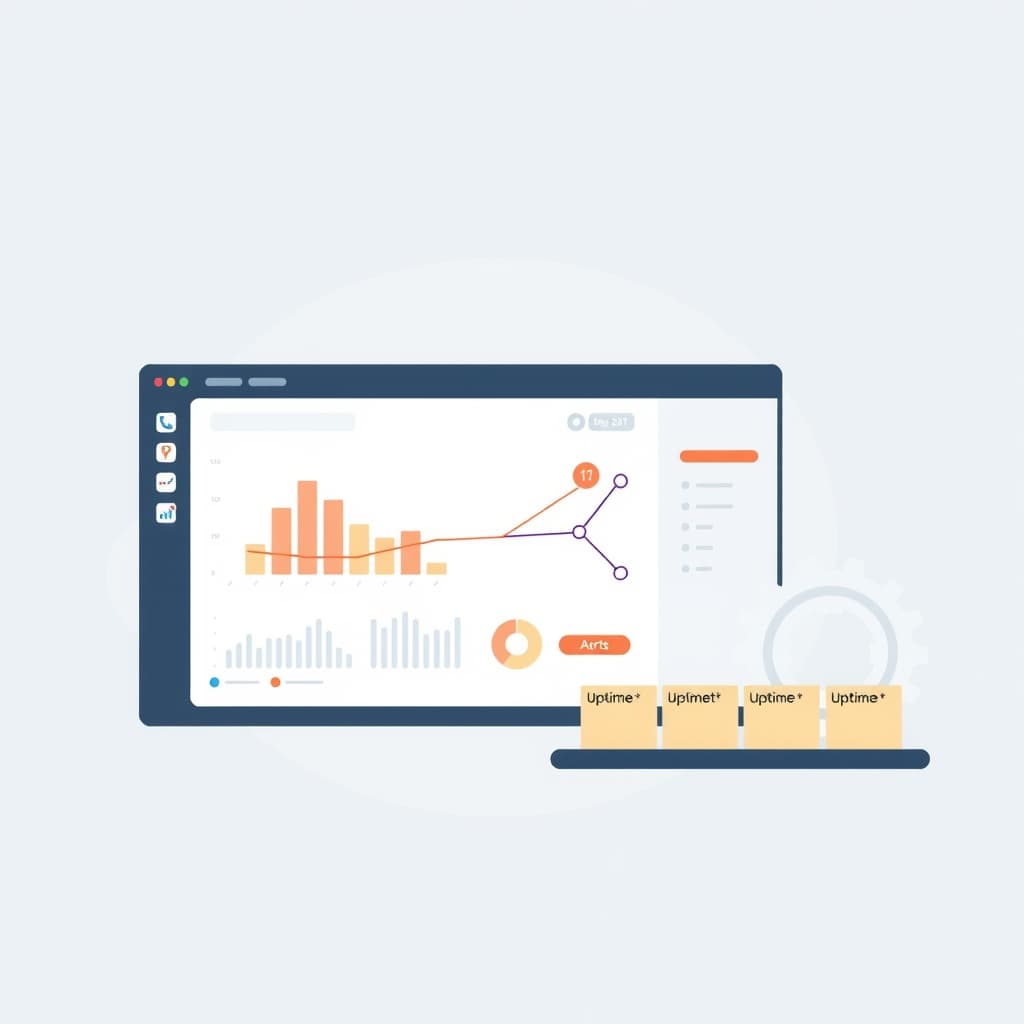
Non‑technical leaders need a clear, jargon‑free view of system health. Build a high‑level dashboard that surfaces the three pillars from the metrics section: uptime, latency, and error rate, each visualized as a traffic‑light indicator. Add a “business impact” widget that correlates technical anomalies with subscription sign‑ups or support tickets. Use tools like Looker or Grafana with role‑based access to keep the UI simple. Pair the dashboard with a brief weekly “health email” that highlights trends and any incidents resolved. This approach mirrors the principles in our How to Prove Internal Ops Dashboard ROI in 7 Concrete Steps guide, turning data into executive confidence.
Automated Incident Response Playbooks: Reducing MTTR
When an alert fires, the clock starts ticking. Automated playbooks cut mean time to recovery (MTTR) by pre‑defining the exact steps to diagnose and remediate. Use a platform like PagerDuty or Opsgenie to trigger a runbook that: (1) gathers relevant logs, (2) runs health‑check scripts, and (3) notifies the correct on‑call. Include conditional branches—for example, if the error originates from a third‑party API, the playbook should open a ticket with the vendor. Store playbooks in version‑controlled markdown so they evolve with the product. Regularly rehearse scenarios in “chaos drills” to ensure the process works under pressure.
Periodic Review Cadence: Updating Checks as Your Product Evolves
Monitoring is not a set‑and‑forget task. Schedule a quarterly review where product, engineering, and ops leads audit the checklist. Ask: Have new features introduced additional dependencies? Have traffic patterns shifted to a new region? Are any metrics consistently noisy and therefore unreliable? Update thresholds, add or retire metrics, and refine alert routing accordingly. Document changes in a changelog linked to your release notes so stakeholders understand the rationale. This cadence keeps the post‑launch monitoring checklist aligned with product maturity and prevents blind spots from creeping in.
Integrating Monitoring with Release Management and Feature Flags
Feature flags give you granular control over rollout risk. Tie monitoring directly to flag state: when a flag is enabled for a subset of users, automatically increase the sampling rate of relevant metrics and lower alert thresholds. Conversely, if a flag is rolled back, suppress the associated alerts to avoid noise. Integrate your CI/CD pipeline (e.g., GitHub Actions or GitLab CI) with the observability platform so that each deployment publishes a version tag to the dashboard. This creates a clear lineage from code change to observed impact, making root‑cause analysis faster and more precise.
Balancing Monitoring Overhead with Cost: Practical Tips for Growing Teams
Observability can become expensive if you collect everything at full resolution. Prioritize high‑value signals and use adaptive sampling: capture detailed traces only for requests that exceed latency thresholds or encounter errors. Retain raw logs for a short window (e.g., 24 hours) and aggregate them into metrics for longer‑term storage. Leverage open‑source agents where possible, and negotiate tiered pricing with vendors based on projected growth. Remember that the cost of a missed outage far exceeds the incremental spend on smarter monitoring.
Conclusion & Next Steps: How SiteFusion Can Help You Institutionalize Reliability
Building a robust post‑launch monitoring checklist is a strategic investment that pays off in reduced downtime, happier customers, and smoother scaling. Our team specializes in designing custom dashboards, automating alert pipelines, and crafting incident‑response playbooks that fit your tech stack. Whether you need ongoing post‑launch support or a full‑scale observability overhaul, we can embed reliability into your product DNA. Ready to turn monitoring into a competitive advantage? Book a call with SiteFusion today and let’s make your SaaS resilient from day one.