For growing B2B companies, a well‑executed customer portal can become a strategic revenue lever, but only if you can demonstrate clear B2B customer portal ROI. Without a disciplined approach to measuring outcomes, portals risk becoming costly vanity projects that add complexity without delivering value. This guide walks founders, product leaders, ops managers, and PMs through six practical steps to quantify impact, tighten execution, and keep the business case solid from day one.
Why ROI matters for B2B customer portals
Investing in a portal touches every layer of the organization—sales, support, finance, and product. When the return on investment is transparent, stakeholders can allocate budget confidently, prioritize enhancements, and justify ongoing maintenance. A strong ROI narrative also protects against scope creep; each new feature must be tied back to a measurable business outcome. Moreover, investors and board members increasingly demand data‑driven proof of value, especially in subscription‑based models where churn and expansion revenue are tightly linked to the portal experience. By treating ROI as a core metric rather than an afterthought, you turn the portal from a cost center into a growth engine that can be benchmarked against other initiatives such as AI automation or internal ops dashboards.
Step 1: Define clear business outcomes before building
The first discipline is to articulate the specific outcomes you expect the portal to achieve. These could be reducing support ticket volume by 30 %, accelerating order processing time from three days to one, or increasing self‑service adoption to 70 % of active users. Write each outcome as a SMART goal—Specific, Measurable, Achievable, Relevant, Time‑bound—so that success is unambiguous. Align these goals with broader company OKRs to ensure cross‑functional buy‑in. A useful starting point is the Ultimate MVP Scoping Checklist for Founders, which helps you surface the most critical problems before any line of code is written. Once the outcomes are locked, you can reverse‑engineer the required data, workflows, and integrations that will make them measurable.
Step 2: Prioritize features that drive measurable value
Feature backlogs explode quickly; without a value filter, you’ll spend months building nice‑to‑have screens that never move the needle. Rank each candidate against the outcomes defined in Step 1, using a simple scoring matrix: impact on the target metric, implementation effort, and risk. Features that directly reduce support load—such as a searchable knowledge base or automated status updates—often deliver the highest ROI early. For more complex capabilities like AI‑driven recommendations, reference the AI Feature Rollout Checklist to validate cost versus benefit before committing resources. This disciplined prioritization ensures that every sprint contributes to the overall B2B customer portal ROI.
Step 3: Design data‑driven dashboards for transparent reporting
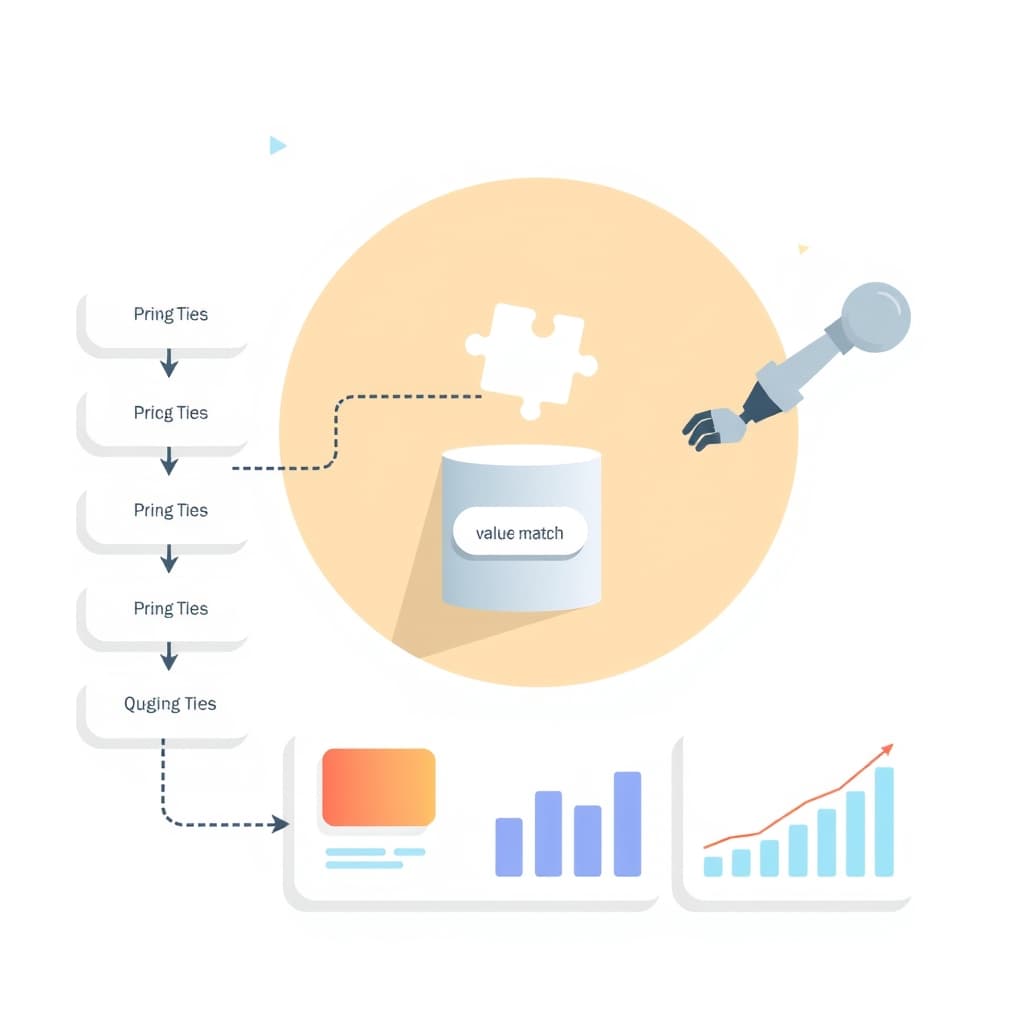
Stakeholders need a single source of truth to see how the portal is performing against its goals. Build dashboards that surface key performance indicators (KPIs) such as active user count, average session duration, ticket deflection rate, and revenue uplift from upsell flows. Use visual cues—traffic lights, trend arrows—to highlight where targets are met or missed. The dashboard itself should be a portal feature, reinforcing the culture of data‑driven decision‑making. For inspiration on framing ROI for internal tools, see our guide on How to Prove Internal Ops Dashboard ROI in 5 Concrete Steps. By making the data accessible to product, ops, and finance teams, you turn reporting into a continuous feedback loop rather than a quarterly exercise.
Step 4: Implement usage tracking and feedback loops
Quantifying adoption requires granular telemetry. Instrument every click, form submission, and API call with a lightweight analytics layer that respects GDPR and data‑privacy standards. Tag events to the outcomes they support—for example, “order‑submitted‑via‑portal” maps to the order‑processing KPI. Pair quantitative data with qualitative feedback collected through in‑portal surveys or NPS prompts. Close the loop by routing high‑priority feedback to the product backlog within 48 hours. This dual‑track approach surfaces hidden friction points early, allowing you to adjust the roadmap before low adoption erodes ROI.
Step 5: Optimize performance to reduce churn and support costs
Slow load times and unreliable integrations are silent killers of ROI. Every second of latency can increase bounce rates and drive users back to legacy channels, inflating support costs. Adopt performance budgets—e.g., sub‑2‑second first‑contentful paint—and monitor them with real‑time alerts. Leverage Next.js server‑side rendering or edge caching to serve static assets quickly, and implement robust API‑integration patterns as outlined in our API Integration Reliability Patterns for Growing SaaS. Regularly run load tests that simulate peak usage to catch regressions before they affect customers. A fast, reliable portal not only improves satisfaction but also directly contributes to lower churn and higher lifetime value.
Step 6: Iterate with A/B testing and continuous improvement
Even after launch, the portal should evolve based on evidence. Set up A/B experiments for high‑impact changes—such as new navigation structures, pricing displays, or AI‑driven recommendations—and measure the effect on your predefined KPIs. Use a statistical significance threshold (typically 95 %) before rolling out to all users. Document each experiment’s hypothesis, results, and next steps in a shared knowledge base. This systematic experimentation creates a virtuous cycle: insights drive improvements, which generate new data, which fuels further tests. Over time, the cumulative lift can double the original ROI projection.
Putting it together: A quick ROI calculator for your portal
To keep the business case visible, use a simple spreadsheet or internal tool that aggregates the following inputs:
- Baseline metrics: current support tickets per month, average order processing time, revenue per user.
- Projected improvements: percentage reduction in tickets, time saved, upsell conversion lift.
- Cost components: development effort (person‑months), third‑party licenses, ongoing hosting and support.
- Time horizon: 12‑month and 24‑month windows to capture both short‑term gains and longer‑term expansion.
Calculate Net Present Value (NPV) by subtracting total costs from the monetized benefits over the chosen horizon. If the NPV is positive and the payback period is under 12 months, you have a compelling case to secure further investment. Update the calculator quarterly with actual data from your dashboards to keep the ROI narrative current.
Conclusion & next steps: When to partner with a custom‑software agency
If you find that internal resources are stretched thin, the scope of integrations is growing, or performance requirements exceed what a low‑code platform can deliver, it’s time to consider a specialist partner. A custom‑software agency can accelerate development, enforce best‑in‑class architecture, and provide the post‑launch support needed to maintain ROI over time. Look for partners with a proven track record in B2B portals—our portfolio of products showcases several successful implementations. When you’re ready to move from planning to execution, book a discovery call so we can align on outcomes, timelines, and the ROI framework that will guide the project.
Ready to turn your portal vision into measurable profit? Book a call with SiteFusion today and let’s start building the ROI‑focused experience your customers—and your bottom line—deserve.
For the complete picture, read our guide to B2B Web Apps & Customer Portals.